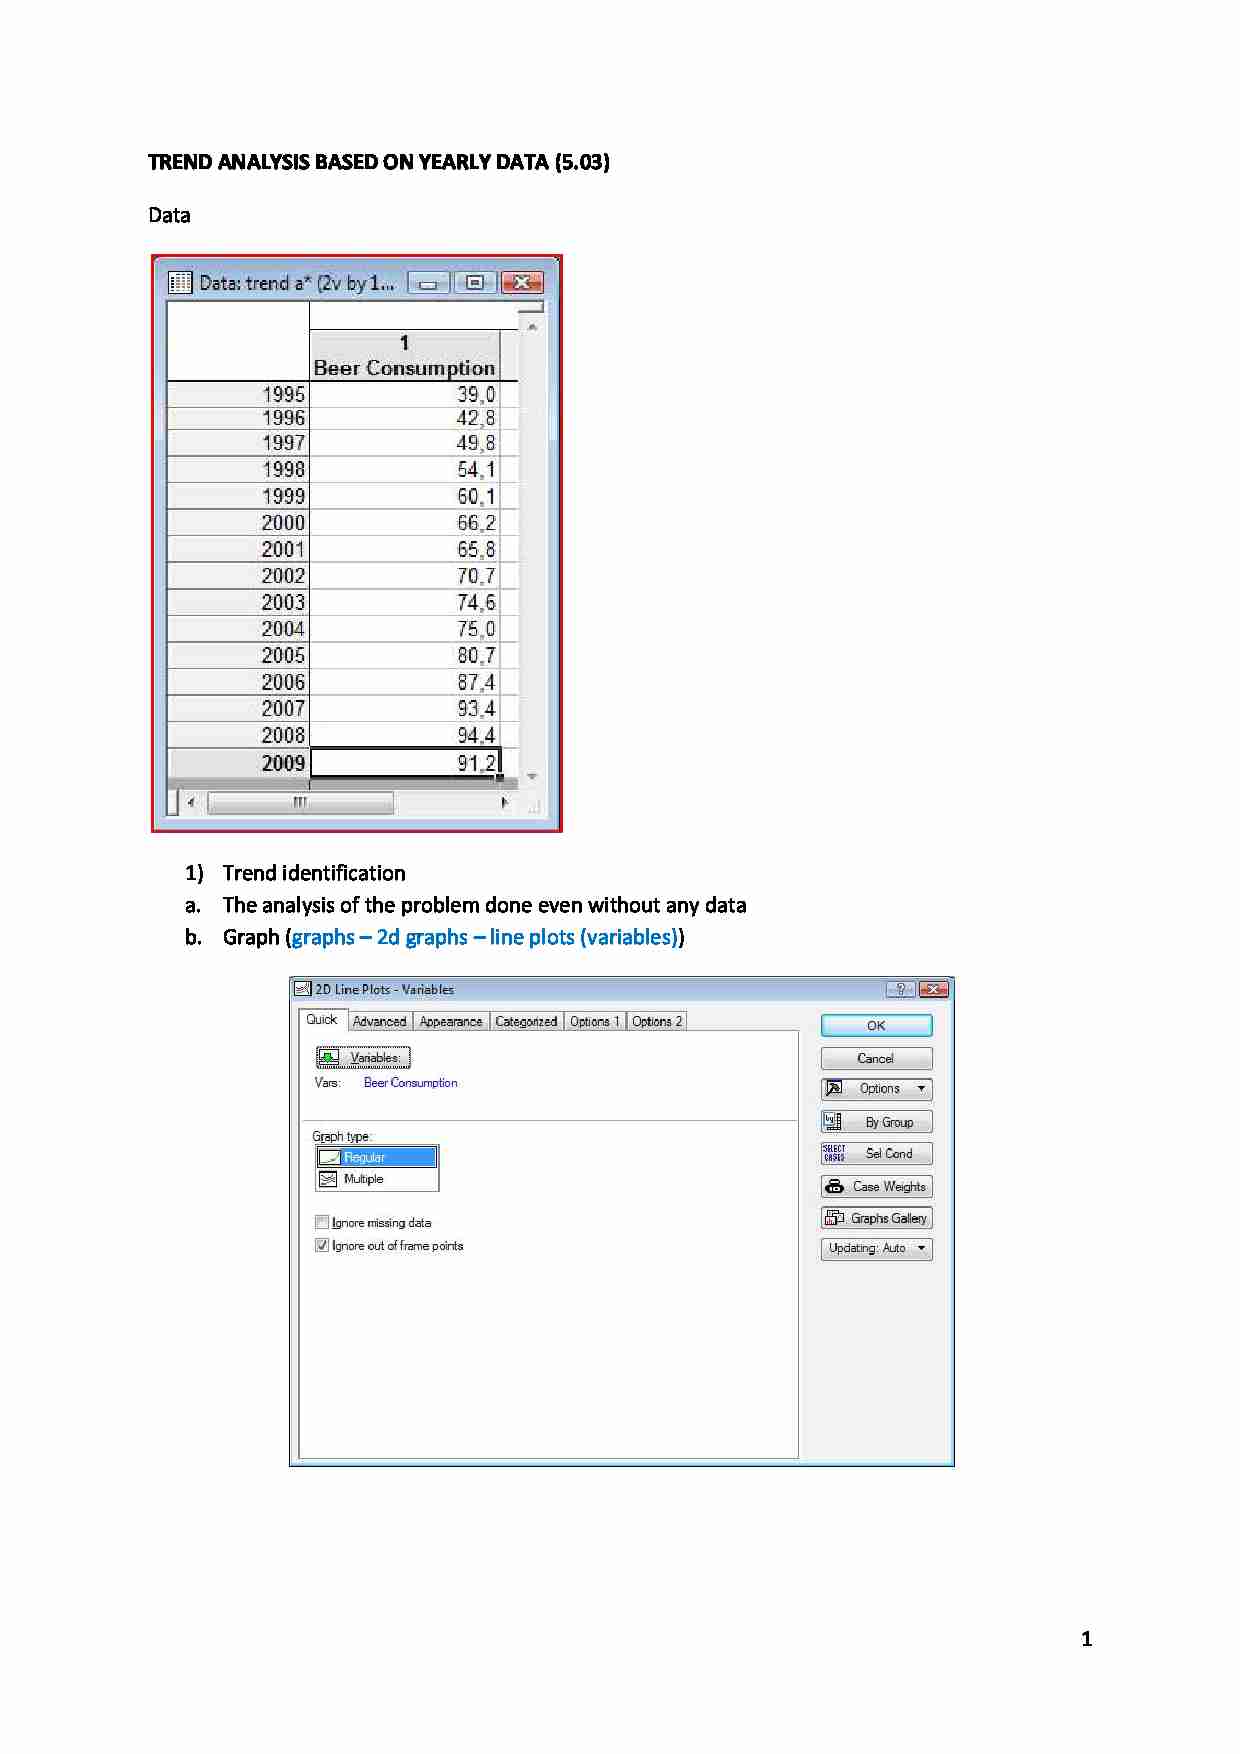
TREND ANALYSIS BASED ON YEARLY DATA (5.03) Data
Trend identification
The analysis of the problem done even without any data Graph ( graphs - 2d graphs - line plots (variables) )
Do we have a trend? Yes, the consumption is growing
Testing trend coeficients
Measurement and modeling
Mechanical - moving averages Moving averages We have to define the lenght of a moving average. Let's take it as 3. We take first 3 observations and calculate the average. The result is assigned to the time unit which is in the middle. Than we move forward, leave out the 1st observation and take into account the fourth one and repeat the procedure of calculating average and so on (the avg is moving along the time series). How long should our moving average should be?:
- longer moving average gives us better smoothing but we loose more observations at the beginning and at the end of the time series
- If we want to eliminate or smoothen the periodical component of k frequency, the moving average should have k (lenght) elements *Where we can find moving avg in our time series in Statistica? ( statistics - advanced linear/non-linear models - time series/forecasting )
Press OK (trannformation…)
Go to smoothing Tab - 3 moving n points
Press OK. again
BUT Here we loose more observations
Analytical - fitting funtions to the data
TREND FUNCTIONS TREND FUNCTION IN THE POPULATION (MECHANISM, which we are studying):
t - time unit
f(t) - analytical shape of the trend function
ζ (xi) - random component, we assume that this random component is normally distributed with expected value 0 and stable variance (stationary process - stable variance is always the same): N(0, σ 2 )
Linear trend function in the population :
β - parameters of the linear trend function (can be positive or negative)
β 0 - intercept (the place in which trend function crosses OY axis (vertical axis), or this is the average level of Y in t=0 (time unit number by0)
β 1 - slope - the average change of Y in 1 time unit (in our case the average yearly change)
We estaimate trend parameter with OLS (Ordinary Least Squares) method.
Linear trend sample (our time series) in the population: y t - observed values of variable y
t - time variable
b 0 - estimator of β 0 : sample intercept
b 1 - estimator of β
... zobacz całą notatkę
Komentarze użytkowników (0)