To tylko jedna z 17 stron tej notatki. Zaloguj się aby zobaczyć ten dokument.
Zobacz
całą notatkę


THE ANALYSIS OF QUARTERLY DATA Data presentation
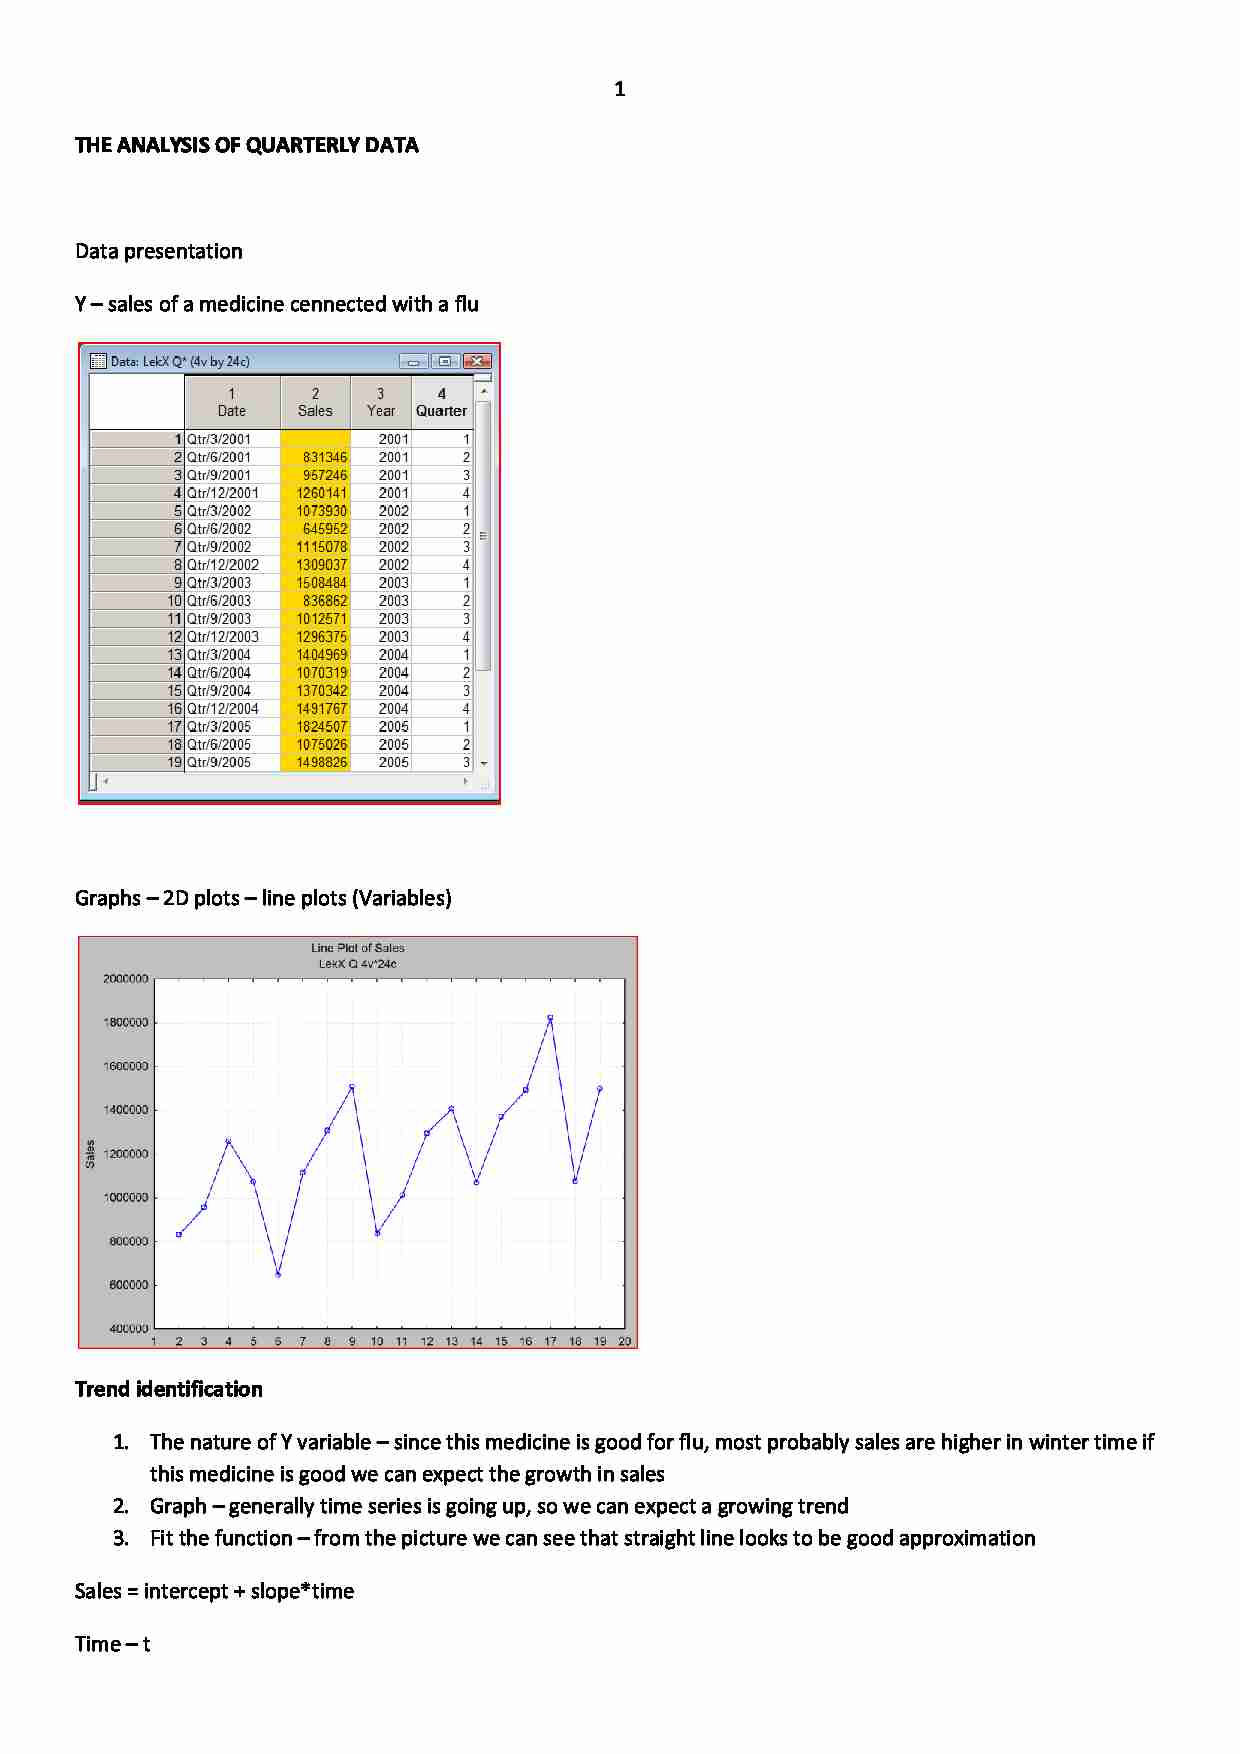
Y - sales of a medicine cennected with a flu
Graphs - 2D plots - line plots (Variables)
Trend identification The nature of Y variable - since this medicine is good for flu, most probably sales are higher in winter time if this medicine is good we can expect the growth in sales
Graph - generally time series is going up, so we can expect a growing trend
Fit the function - from the picture we can see that straight line looks to be good approximation
Sales = intercept + slope*time
Time - t
OK.
We can estimate the linear trend in Multiple Regression Statistics - multiple regression
Press SUMMARY: Regression results
p-value for the slope is smaller than the significance level (0,0109 analysis of variance
P value (0,0001) is definitely smaller than significance level of 0,05 so we reject H 0 and accept H 1 . It means that we have a significant seasonal component in our time series
-categorized box&whisker
Mean - the middle of the plot (averages)
SE - standard error of the mean - the height of a box
1,96*SE - the length of whiskers (1,96 has been taken from the table of standard normal distribution)
Mean ± 1,96*SE - 95% confidence interval for the mean
Summary: table of statistics
08-05-2012 Modelling quarterly data MODEL WITH DUMMY VARIABLES (KLEIN'S MODEL) Dummy variables - “artificial” variables assuming only two values: 0 and 1. 1 is used to mark the special time unit. For quarterly data we need three dummy variables. One quarter is considered as a base one. Very popular practise is to take as a base this quarter which has the smallest value of deviations from the trend. In our case this is quarter number two.
... zobacz całą notatkę


Komentarze użytkowników (0)