To tylko jedna z 12 stron tej notatki. Zaloguj się aby zobaczyć ten dokument.
Zobacz
całą notatkę


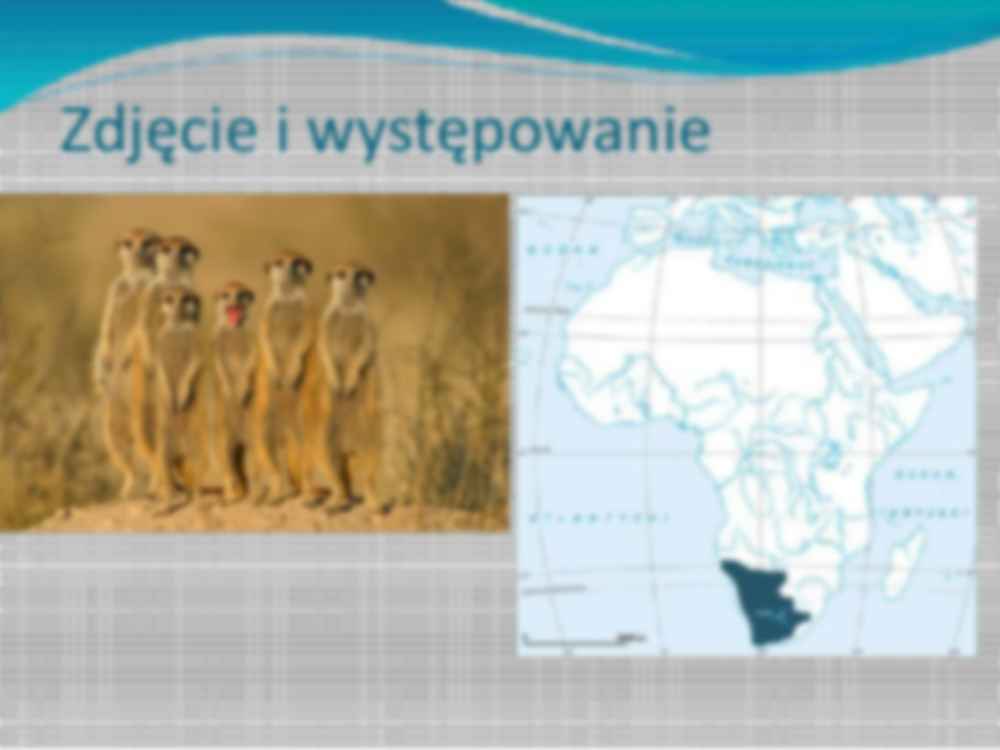
Surykatka ( Suricata suricatta) Ogólne informacje Smukła sylwetka, wierzch ciała jasnopopielaty z czarnym, poprzecznym pręgowaniem. Głowa biała, uszy czarne. Ogon ciemno żółty o czarnym końcu. Długość ciała: 25-35 cm Długość ogona: 17-25 cm Waga: 720-731 g Wszystkożerna, głównie owady i inne bezkręgowce, ale również gady, ptaki i ssaki uzupełnione pokarmem roślinnym. Zdjęcie i występowanie Moja populacja Grupa surykatek żyjąca we wschodniej części Kalahari Okres obeserwacji populacji - od kwietnia 1993 do kwietnia 1996 Liczba osobników w populacji : 82-102 osobniki Teren obserwacji : The Park Struktura przestrzenna Populacja składa się z 10 grup surykatek Każda z grup w populacji składała się z 3 do 14 dorosłych surykatek Typowe rozmieszczenie skupiskowe Struktura płciowa Samców jest znacznie więcej w populacji niż samic Widoczne jest to, że rodzi się więcej samców niż samic 0 2 4 6 8 10 12 Liczba osobników Liczebność płci Struktura wiekowa Predation, group size and mortality in a cooperative mongoose, Suricata suricatta Journal of Animal Ecology Volume 68, Issue 4, p ages 672-683, 25 DEC 2001 DOI: 10.1046/j.1365-2656.1999.00317.x http://onlinelibrary.wiley.com/doi/10.1046/j.1365-2656.1999.00317.x/full#f4 Survival and group size for 1994/95. (a) Numbers of deaths per head in groups of different sizes (filled squares). Curve fitted using values predicted from the logistic regression model. (b) Probability per head of dying during the year. (c) Probability of all animals but one within the group dying during the year, the solid line shows the probability calculated using a stochastic model assuming that mortality is random across group sizes. Predation, group size and mortality in a cooperative mongoose, Suricata suricatta Journal of Animal Ecology Volume 68, Issue 4, p ages 672-683, 25 DEC 2001 DOI: 10.1046/j.1365-2656.1999.00317.x http://onlinelibrary.wiley.com/doi/10.1046/j.1365-2656.1999.00317.x/full#f1 Figure 1. (a) Mean annual mortality for adults during 3 years in the park and at the Ranch. Figures above each histogram show the number of animals monitored. No measures of variance are shown since all animals in the study population were included and the figure shows actual rates rather than estimates. (b) Mean annual mortality for male and female juveniles (3–12 months) and adults ( 12 months) in the
... zobacz całą notatkę


Komentarze użytkowników (0)