To tylko jedna z 27 stron tej notatki. Zaloguj się aby zobaczyć ten dokument.
Zobacz
całą notatkę


Cels
sius degrees
22
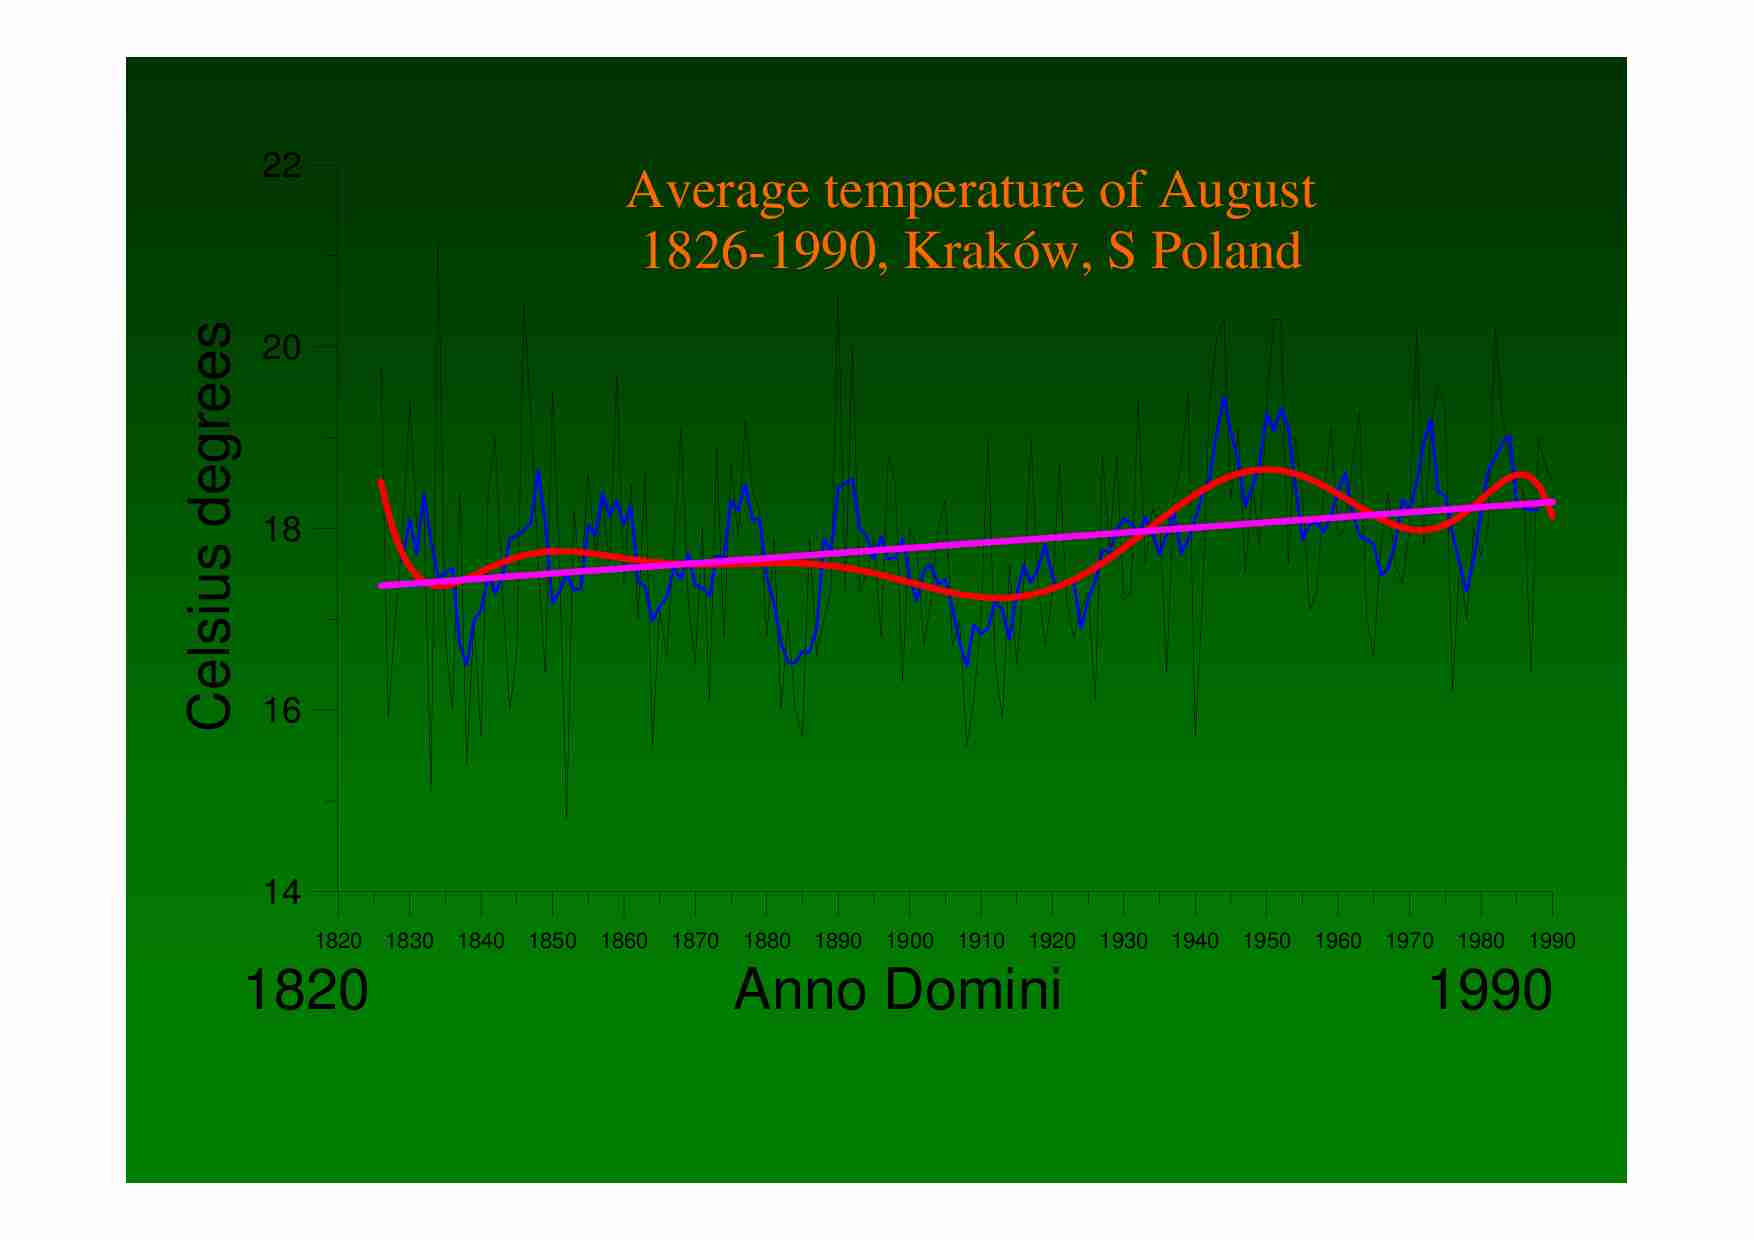
Average temperature of August
1826-1990, Kraków, S Poland
20
18
16
14
1820
1820
1830
1840
1850
1860
1870
1880
1890
1900
1910
1920
Anno Domini
1930
1940
1950
1960
1970
1980
1990
1990
wzrost stężenia: 0,8-1,4 % /rok
Ralationship between atmospheric CO2 concentration and δ13CCO2
(after Keeling 1958)
Seasonal δ13C variations of
atmospheric CO2
from five northern hemisphere stations
[dial ebullition of methane in: g of carbon from 1 cubic meter of sediments]
Ebulli
itive methane
1E+0
0
1E-4
1993
200
1E-5
1E-6
400
depth of water,
till 07/1997
2.8m
4.2m
4.5m
1994
600
9.0m
1995
800
95.07.19-10.07
95.05.20-07.02
95.07.02-07.19
1996
1000
1200
Time ralative to 1993.06.01 [days]
97.04.19-97.06.25
97.06.25-97.08.09
97.08.09-97.09.05
97.09.05-97.09.21
96
6.04.19-97.04.19
95.02.2
25-05.20
94.12.20-95.02.25
5
94.08.01-12.20
94.03.07-06.05
94.06.05-06.09
94.06.09-06.24
93
3.11.18-03.07
93.07.03-10.29
1E-3
95.10.07-96.04.19
1E-2
93.06.16-07.03
1E-1
Methane from
freshwater
lake sediments,
Nowa Cerekiew
depth of water,
after the flood
of July 1997
3.9m
1997
1400
1600
depth in the sediments [m]
d
0
-1
Lake Moszne,
E Poland
92.09.27
93.05.01
-2
93.07.17
93.08.30
93.11.14
94.02.11
-3
-68
-64
-60
-56
-52
δ Cbubble methane
13
-48
-44
[‰]
Lake Nowa Cerekiew,
SW Poland
13
18:45
22:10
-60
4:45
-55
11:10
-50
16:50
δ C bu methane [‰]
ubble
-45
sampling stations
at depths:
0.8m
-65
3.9m
4.6m
-70
9.0m
-75
10:00
20:00
97.09.21
6:00
time [hours]
16:00
2:00
97.09.22
13
δ C bubble methane
e
[‰]
-45
-50
15:02
12:00
11:40
18:00
17:55
21:00
09:09
07:00
03:00
00:00
-55
21:04
-60
depths and dates
-65
0.15 m, 94.07.03-04
-70
0.7 m, 94.07.03-04
Lake Sulistrowiczki,
SW Poland
0.25 m, 95.08.01-03
0.7 m, 95.08.01-02
-75
12:00 18:00
24/0
6:00
12:00 18:00
24/0
6:00
time [hours]
94.07.03
95.08.01
/ 94.07.04
/ 95.08.02
/95.08.03
CH4
CO2
CH3COOH
-300
Incubation experiment
1998-2000
-320
δDbubble methane
b
-340
-360
-380
-400
parameters:
light and depth of the water
15 cm
56 cm
no light
Y=-24.695*X-2080.29
R-squared = 0.91
-420
-440
-70
-68
-66
δ13Cbubble methane
-64
-62
Does oxidation of methane
may result in substantial
precipitation of carbonates ?
depth of the water column [m]
0
-4
----------------------------------------thermocline
-8
Mixing of benthic and surface waters
compared to stagnation periods
sampling in mid-day
mixing, 103 of data points
stagnation, 101 of data points
-12
Bubble methane from lakes and rivers
-80
-70
δ
13
-60
-50
C bubble methane [‰]
-40
-30
Jon siarczanowy w wodach jeziornych i rzecznych
oraz opadach atmosferycznych 1993-1995
w Polsce
opady atm.
n = 24
sr.X = 3.26
sr.Y = 14.87
R*R= 0.00
siarczan igiel
20
Biale Wig.
Bug
Czarna Hancza
Czarne
Czarny Staw
Czerwone Bagno
Goczalkowickie
Goreckie
Gosciaz
Hancza
Maly Staw Kark.
Morskie Oko
Moszne
Narew
Niegocin
Nowa
(…)
… hydratów)
oraz efekt "bottom simulating reflection" BSR, pod nim czesto jest luźny osad z wodą (1.5
km/s) i gazem – duży kontrast akustyczny – silny refleks fal dźwiękowych.
Cement, żyły, nodule etc.
Występowanie: skłony (stoki) kontynentalne - min. 300m gł. wody, zwykle 90-900m poniżej
pow. osadu. - intensywna sedymentacja i dostawa materii organicznej szybko izolowanej od
strefy bogatej w jon siarczanowy i tlen. Obszary polarne, permafrost.
Miąższość – do kilku metrów.
Ilość: złoża odkryte w latach 1970tych – wiercenia. 3 rzędy (ok.. 3,000 razy?) więcej w hydratach
niż w atm. Ok. 2 * więcej węgla niż w innych znanych złożach paliw kopalnych.
Implikacje:
-geologiczne: cementowanie skal osadowych, uszczelnianie, tworzenie pułapek dla np.
węglowodorów (sprzężenie zwrotne). Ruchy osadów – osuwiska…
... zobacz całą notatkę


Komentarze użytkowników (0)